
Project type: ASP.NET Core MVC & jQuery
Version: v7.2.3 (latest)
Framework: .NET Core 2.2
During the last few months we have noticed a constant performance degradation in our ASP.NET Core solution.
We are experiencing very slow project startup, and then very slow load time the first time a controller action is executed, and also high memory usage.
We have measured the following values using dotTrace:
-
Time to execute
services.AddAbp(): 2.328 ms -
Time to execute
app.UseAbp(): 20.027 ms -
Time from application start to first page loaded: 1:20 minutes
-
Time to load second page: 0:31 minutes
-
Time to load third page: 0:06 minutes
-
Memory usage before
app.UseAbp(): 200 MB -
Memory usage after
app.UseAbp(): about 400MB -
Memory usage after
app.UseMvc(): about 560 MB -
Memory usage after first page loaded: about 1.1 GB
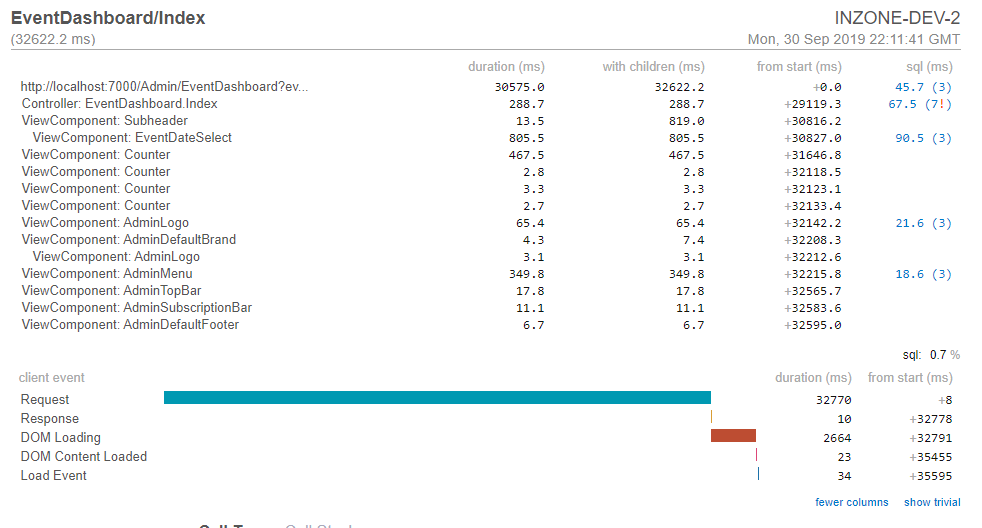
Also we have noted with MiniProfiler that the slow performance is not located in our Controller / App Services / EF Queries but in some external code related to ABP or Castle.Windsor as you can note here:
After a controller action has loaded for the first time, subsequent requests to the same action are fast, but after about 30 minutes then the same request takes a long time to load, even when having IIS App Service configured with the AlwaysRunning setting.
We would like to know how to find what is the exact module that is causing this slow performance and how to fix it.
It might be related to the memory caches (AbpCache), abp localization sources, razor view cache or Castle.Windsor dependency resolving.
We are not sure if there is a way to use dotTrace to display every step made since a request is received until the response is sent so we could see a timeline for the request and indentify the slow modules.
Can you please guide us to find a solution?
Maybe this is a known issue within ABP.
4 Answer(s)
-
0
Hi @inzone
Two possible problems come to my mind:
-
Do you use any caching ? Maybe cache expires and it is slow to refill the cache ?
-
You can also try to disable EF Core's client side query execution. Some of your queries might be executed on client side and it might cause first request to be very slow.
-
-
0
Hello @ismcagdas
It might be the cache, but I don't know how could I measure how fast how each cache is loading to find the problematic one. Any ideas on how to log the time that each cache takes to load?
Then I don't think it's the SQL queries, as you can see in the screenshot I attached to the first post, SQL takes around 300 ms of the 32622 ms that the page took to load.
-
0
-
Have you defined any specific cache expcept the ones already exist in the default template ?
-
Does this happen for more than one Controller or just for EventDashboard controller ?
Could you also share one of the problematic controller ?
Thanks,
-
-
0
This issue is closed because it has not had recent activity for a long time.
