Activities of "inzone"
Hello @ismcagdas
It might be the cache, but I don't know how could I measure how fast how each cache is loading to find the problematic one. Any ideas on how to log the time that each cache takes to load?
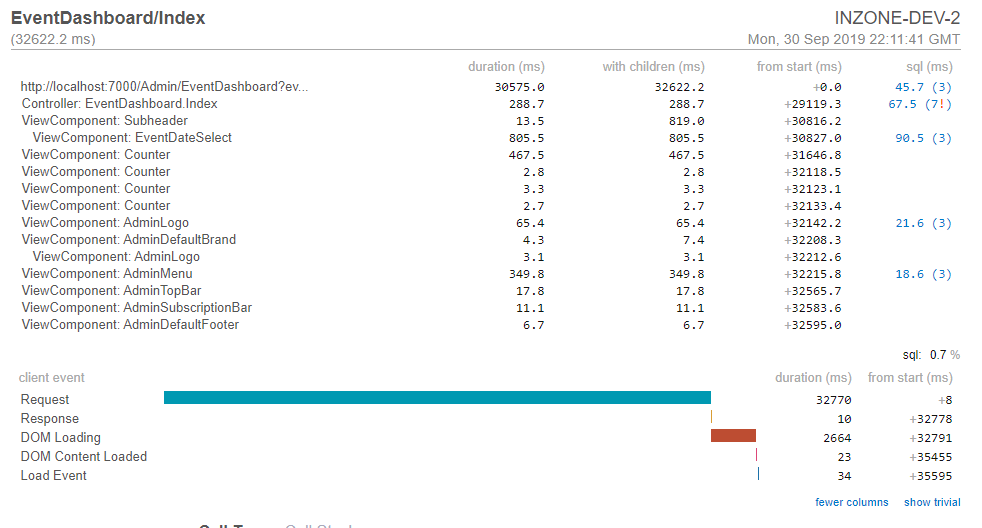
Then I don't think it's the SQL queries, as you can see in the screenshot I attached to the first post, SQL takes around 300 ms of the 32622 ms that the page took to load.
Project type: ASP.NET Core MVC & jQuery Version: v7.2.3 (latest) Framework: .NET Core 2.2
During the last few months we have noticed a constant performance degradation in our ASP.NET Core solution. We are experiencing very slow project startup, and then very slow load time the first time a controller action is executed, and also high memory usage.
We have measured the following values using dotTrace:
- Time to execute
services.AddAbp(): 2.328 ms - Time to execute
app.UseAbp(): 20.027 ms - Time from application start to first page loaded: 1:20 minutes
- Time to load second page: 0:31 minutes
- Time to load third page: 0:06 minutes
- Memory usage before
app.UseAbp(): 200 MB - Memory usage after
app.UseAbp(): about 400MB - Memory usage after
app.UseMvc(): about 560 MB - Memory usage after first page loaded: about 1.1 GB
Also we have noted with MiniProfiler that the slow performance is not located in our Controller / App Services / EF Queries but in some external code related to ABP or Castle.Windsor as you can note here:

After a controller action has loaded for the first time, subsequent requests to the same action are fast, but after about 30 minutes then the same request takes a long time to load, even when having IIS App Service configured with the AlwaysRunning setting.
We would like to know how to find what is the exact module that is causing this slow performance and how to fix it. It might be related to the memory caches (AbpCache), abp localization sources, razor view cache or Castle.Windsor dependency resolving.
We are not sure if there is a way to use dotTrace to display every step made since a request is received until the response is sent so we could see a timeline for the request and indentify the slow modules.
Can you please guide us to find a solution? Maybe this is a known issue within ABP.
We use Hangfire for our Background Jobs, but as documented, periodic background workers don't use Hangfire.
If I enable Quartz, do I get a dashboard like in Hangfire for my background workers? I need to be able to easily monitor our background workers activity, to diagnose exceptions or performance issues.
We also use Application Insights, but as it's a request based profiler, it doesn't get stats related to background workers.
Also we find that when a background worker is working on a long running process that takes a large dataset from the database, any other non background process can't insert or update to the tables related with that dataset. If I set all Unit Of Work methods associated to the background worker as non transactional, all those tables will be unlocked so I don't get SQL timeouts on regular user activity?
The DisplayName Attribute could work, but how do I hook it up with the ABP Localization source?
Does AbpDisplayNameAttribute work for this?
I think that's not exactly what I'm talking about.
Look at this example.
public class RegisterInput
{
    [Required]
    public string FirstName { get; set; }

    [Required]
    public string LastName { get; set; }
}
Using that DTO with validation and provide this JSON to the app service:
{ firstName: "Emiliano", lastName: null }
Then I will end up with an exception with a message like
The field LastName is required
I want to change that LastName to Last Name
Is there any data attribute to set to the property to tell ABP to show Last Name as the display name for that property?
When I get UserFriendlyExceptions related to DTO Validation (AbpValidationException) the exception message detailing the properties with errors display the property name as defined in the DTO class.
Is there any way to set a localized display name for those properties so the error messages the users can get are more clear about what fields have errors?
You can query data using Repositories. Read more: <a class="postlink" href="https://aspnetboilerplate.com/Pages/Documents/Repositories">https://aspnetboilerplate.com/Pages/Doc ... positories</a>
Hello,
For some external integrations that use redirects to the AspNetZero based application I need to debug with SSL (HTTPS) I've tried enabling SSL to the project, but I am getting no response when trying to access the HTTPS URL.
Any further steps to be done in order to fully enable SSL to the AspNetZero solution?
Thank you!
<cite>aaron: </cite> Override ShouldFilterEntity and CreateFilterExpression in your DbContext.
Ok, I see I can get it done easily that way.
In order to get the filter parameter defined with IUnitOfWork.SetFilterParameter, I have to use IUnitOfWork.GetFilter and check in the DataFilterConfiguration.FilterParameters collection, right?
Hello,
I need to implement a data filter for our Event entity. The filtering should be done by Event Id, retrieved from an IEventSession we defined, and should be overriden with the UnitOfWork SetFilterParameter method.
This is what I have done so far, according to this document: <a class="postlink" href="https://aspnetboilerplate.com/Pages/Documents/Data-Filters">https://aspnetboilerplate.com/Pages/Doc ... ta-Filters</a>
Defined the interfaces IMayHavEvent and IMustHaveEvent Defined filter names in a static class Registered the filters at the Core project Module using Configuration.UnitOfWork.RegisterFilter
So what I need to do now, is to do the actual filtering. The docs say that EntityFramework.DynamicFilters do not apply for EF Core, so what is the most convenient way to implement the filter? If I do it at repository level, what should I override at the RepositoryBase abstract class?
Thank you!