
ASP.NET Zero Version: 11.0.1 .NET 6 / Angular UI
I'm getting continual SignalR errors in the browser console - this happens both deployed to an Azure environment (with WebSockets enabled) and locally on my machine:
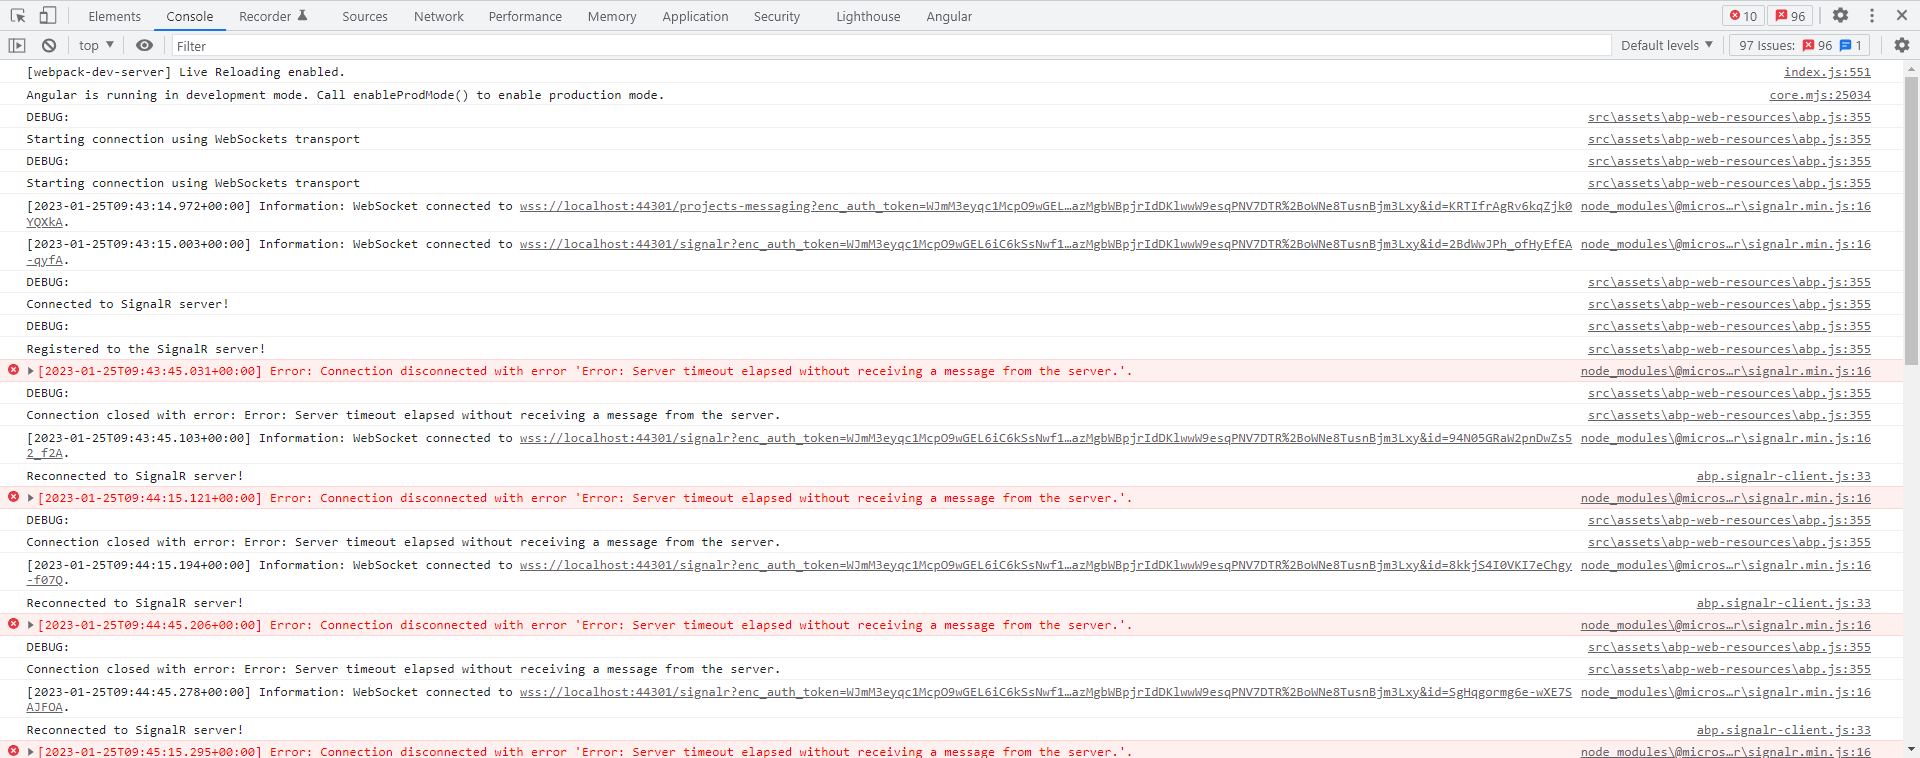
In the screenshot, you can see successful connections for both AppCommonHob/signalr and my projects-messaging hub.
When I use my projects-messaging hub on a long running background process, it communicates to the client for about 2 minutes, after which the client no longer gets any updates. No exceptions are thrown in the back-end though.
Can you offer any help with this please?
6 Answer(s)
-
0
Hi,
Could you try to increased https://learn.microsoft.com/en-us/javascript/api/%40microsoft/signalr/hubconnection?view=signalr-js-latest#@microsoft-signalr-hubconnection-servertimeoutinmilliseconds and see if it helps ?
-
0
Hi,
I've already tried that, and many other SignalR articles about this. I've also tried disabling all the ASP.NET Zero built-in SignalR classes and adding SignalR manually to test if these timeouts occur - they do not. However, that option is not open to me to pursue as I need the features that can target tenants/users specifically and we want to use notifications as a future feature too.
Do you have an out-of-the-box ASP.NET Zero application (same specs - .NET 6 / Angular 13) and does it exhibit the same issue I've shown?
-
0
Hi,
Unfortunately we don't have this problem on our deployed applications. Have you contacted with Azure or did you check the Azure logs ? Maybe you can find a useful error message.
-
0
The issue doesn't just happen in Azure, it happens on my local machine. I only deployed to our Azure development environment to see if the issue changed or went away.
I haven't changed anything to do with SignalR since originally creating the solution. Can you offer any support with this please?
-
0
Hi @elecosoftseservice
If it happens consistently, is it possible to share your source code via [email protected] and share the steps to reproduce ? We can check it for you and try to find the problem.
-
0
Hi, I finally got this issue resolved and just wanted to share the solution in case it helps anyone else with a similar issue.
In the productname.Web.Host project, open the Startup.cs file and find the ConfigureServices() function. In the code, there will be a line that registers the SignalR service and sets some timeouts/intervals.
options.KeepAliveInterval - default is 15 seconds options.ClientTimeoutInterval - default is 30 seconds - should be at least double the KeepAliveInterval value options.HandshakeTimeout - default is 15 seconds
I used 15, 30 and 60 seconds respectively as this seemed to work well, but you're needs may be different.
You can also set EnableDetailedErrors = true to increase the logging details to help debug any issues you're getting (details will be written to the Log file in the App_Data/Logs folder).
On the client-side (in my solution this is an Angular SPA) there is an Abp (ASP.NET Boilerplate) file named abp.signalr-client.js that is loaded, but it logs too much to the console in normal operation, and not enough when you want to debug issues. The solution I took here was to make a copy of the file so changes could be made to the code, then change the path to this one instead.
Open the file SignalRHelper.ts in the src/shared/helpers/ folder. Scroll down and in the code is a line that sets the path to the abp.signalr-client.js file:
script.src = AppConsts.appBaseUrl + '/assets/abp/abp.signalr-client.js';Find this file in your solution folder and make a copy; paste it into a folder in your project such as /assets/abp-web-resources/. Change the above line of code to point to this file instead:
script.src = AppConsts.appBaseUrl + '/assets/abp-web-resources/abp.signalr-client.js';Now open the file and comment out any of the lines that start with abp.log.debug, except for those in a catch() block (unless you want to suppress those too) - this will cut down on the "chatty" browser console logging in normal operation.
Next find the startConnection() function and the line var connection = new signalR.HubConnectionBuilder() - you can add in an important line here to enable auto reconnect:
var connection = new signalR.HubConnectionBuilder()
            .withUrl(url, transport)
            .withAutomaticReconnect()
...and if you want to help diagnose any SignalR issues you're having, add the line:
.configureLogging(signalR.LogLevel.Debug)This will output a lot of entries to the browser console, but it can be really helpful.
Also, because we're now using our version of abp.signalr-client.js, angular.json needs entries for the file, e.g.
"assets": [
"src/assets",
"src/metronic",
    "src/favicon.ico",
{
    "glob": "abp.signalr-client.js",
	    "input": "node_modules/abp-web-resources/Abp/Framework/scripts/libs",
    "output": "/assets/abp"
}
],
